BUENA VISTA INFORMATION
Special Education/Dyslexia
District Quick Links
STUDENTS & GUARDIANS
STAFF RESOURCES
DEPARTMENTS
ADMINISTRATION
STUDENT SERVICES
HEALTH & SAFETY
Texas Education Agency
2022 Federal Report Card
BUENA VISTA SCHOOL (186901001) - BUENA VISTA ISD - PECOS COUNTY
Part (i): Description of State Accountability System
Part (i)(I) the minimum number of students that the State determines are necessary to be included in each of the subgroups of students for use in the accountability system. The Texas accountability minimum size criteria are 25 tests for assessment related indicators or 25 students for non-assessment related indicators, such as graduation, for any student group, and 10 tests or students for the all student group.
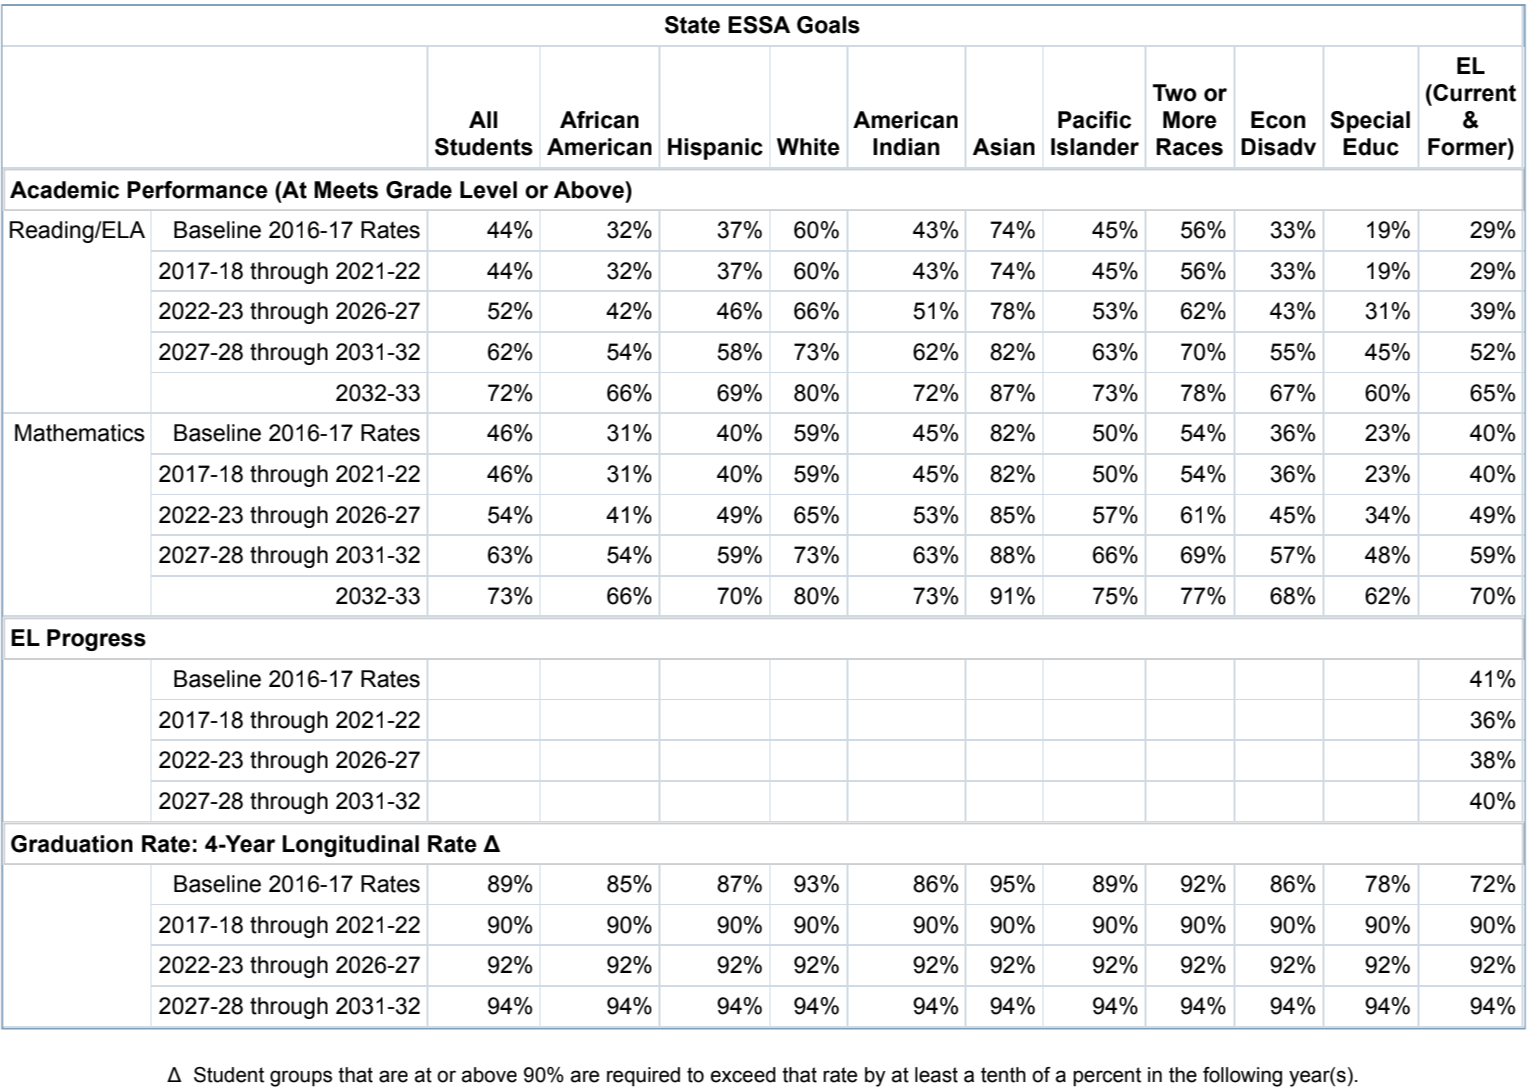
Part (i)(II) the long-term goals and measurements of interim progress for all students and for each of the subgroups of students.
Part (i)(III) the indicators used to meaningfully differentiate all public schools in the State:
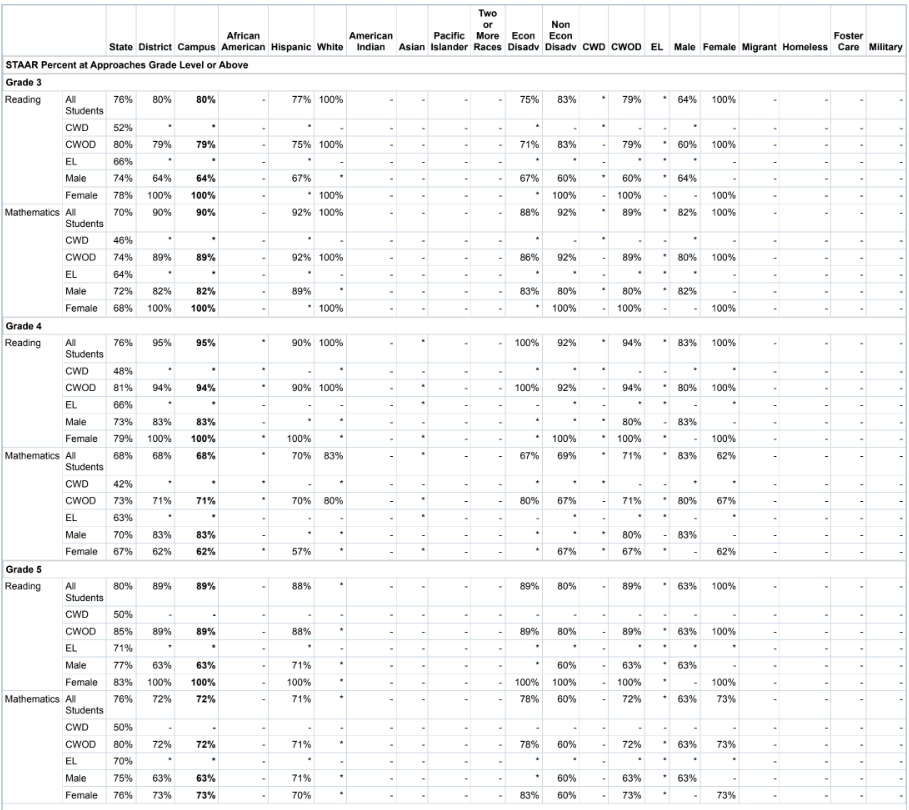
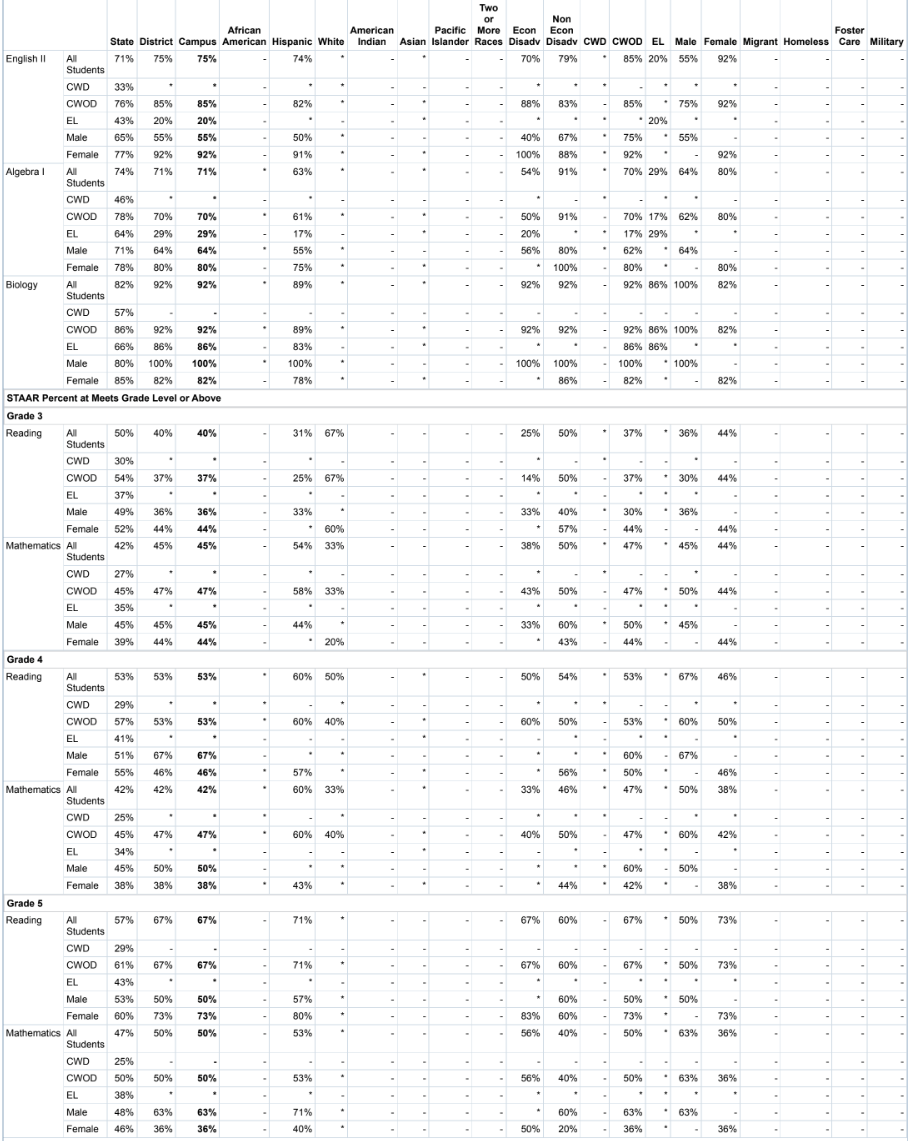
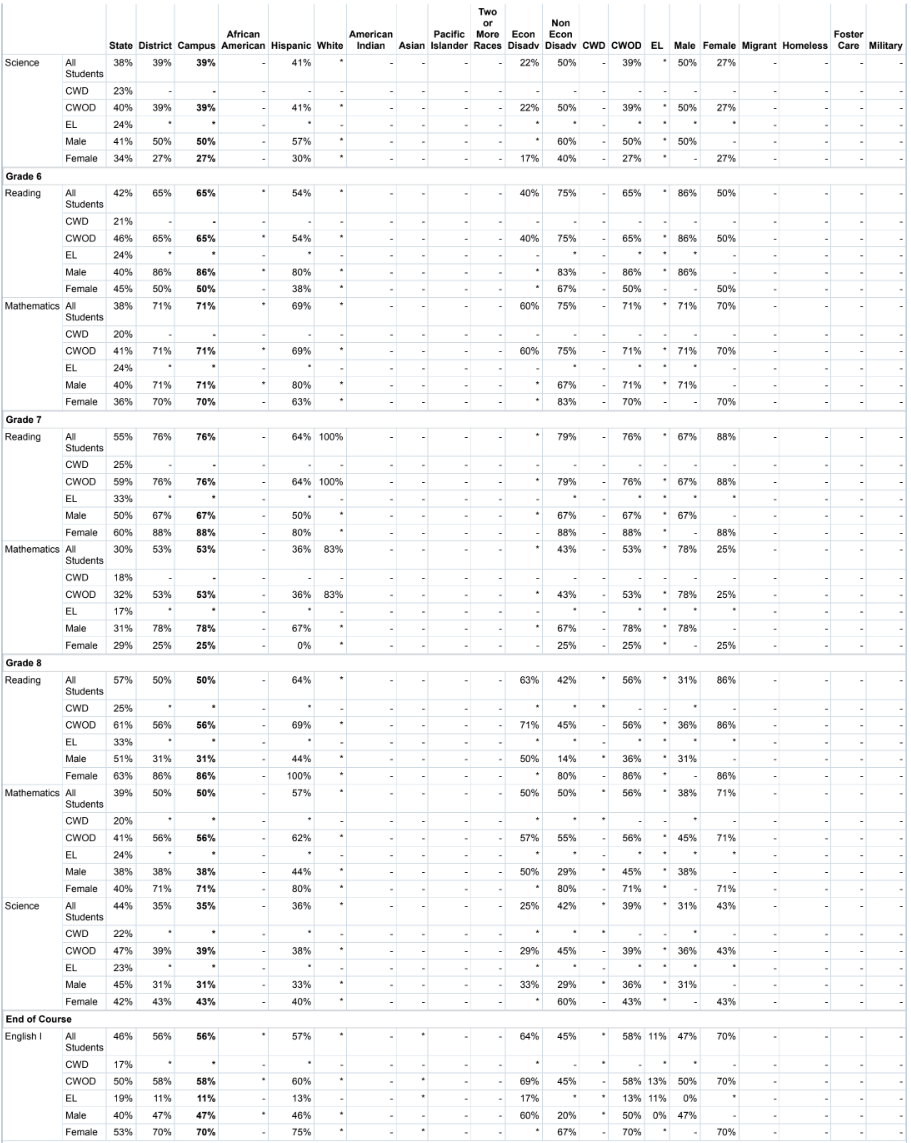
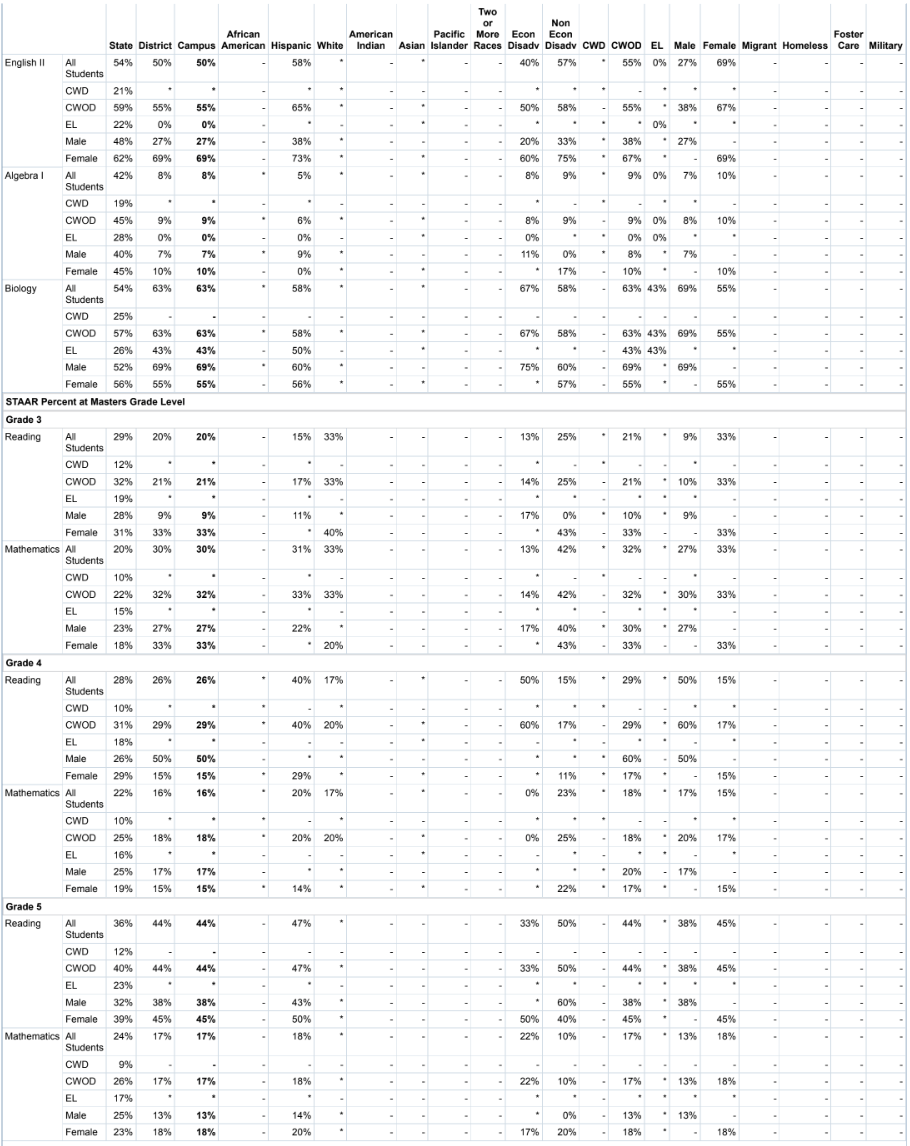
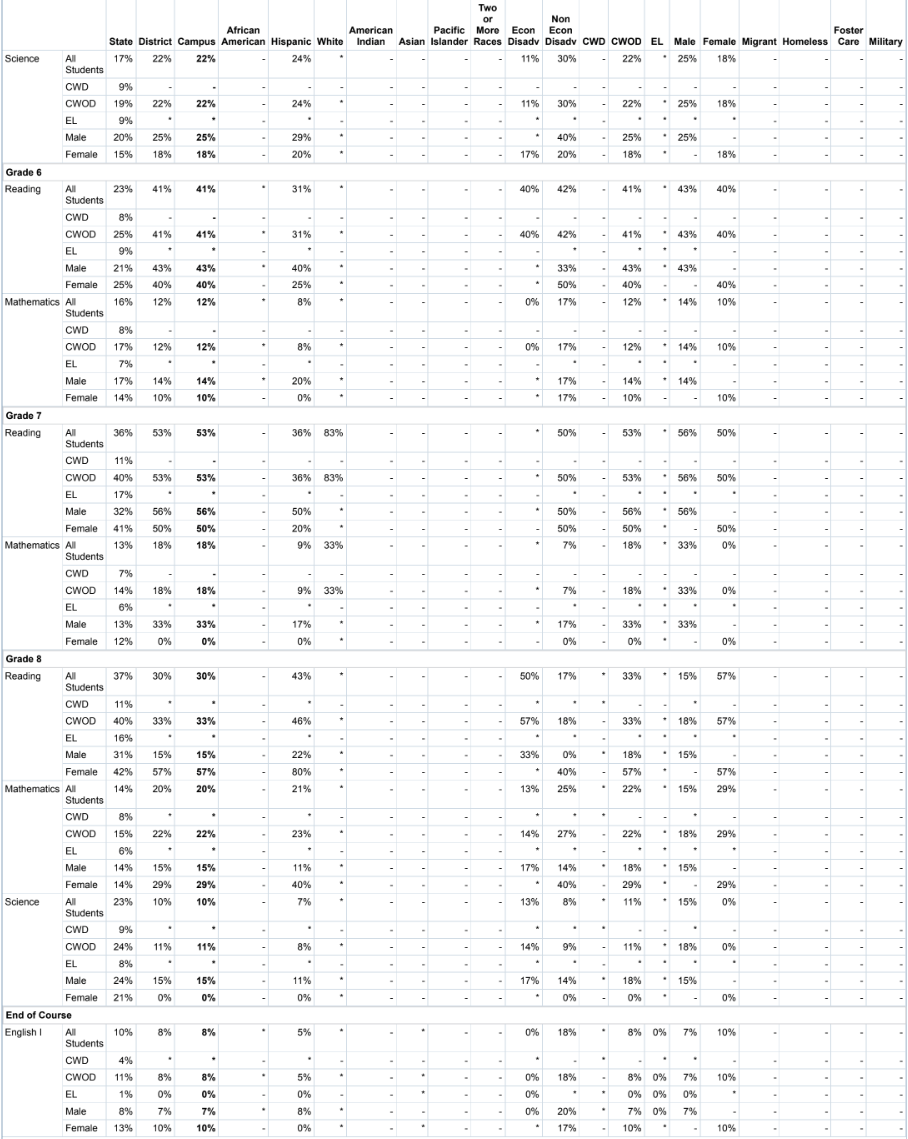
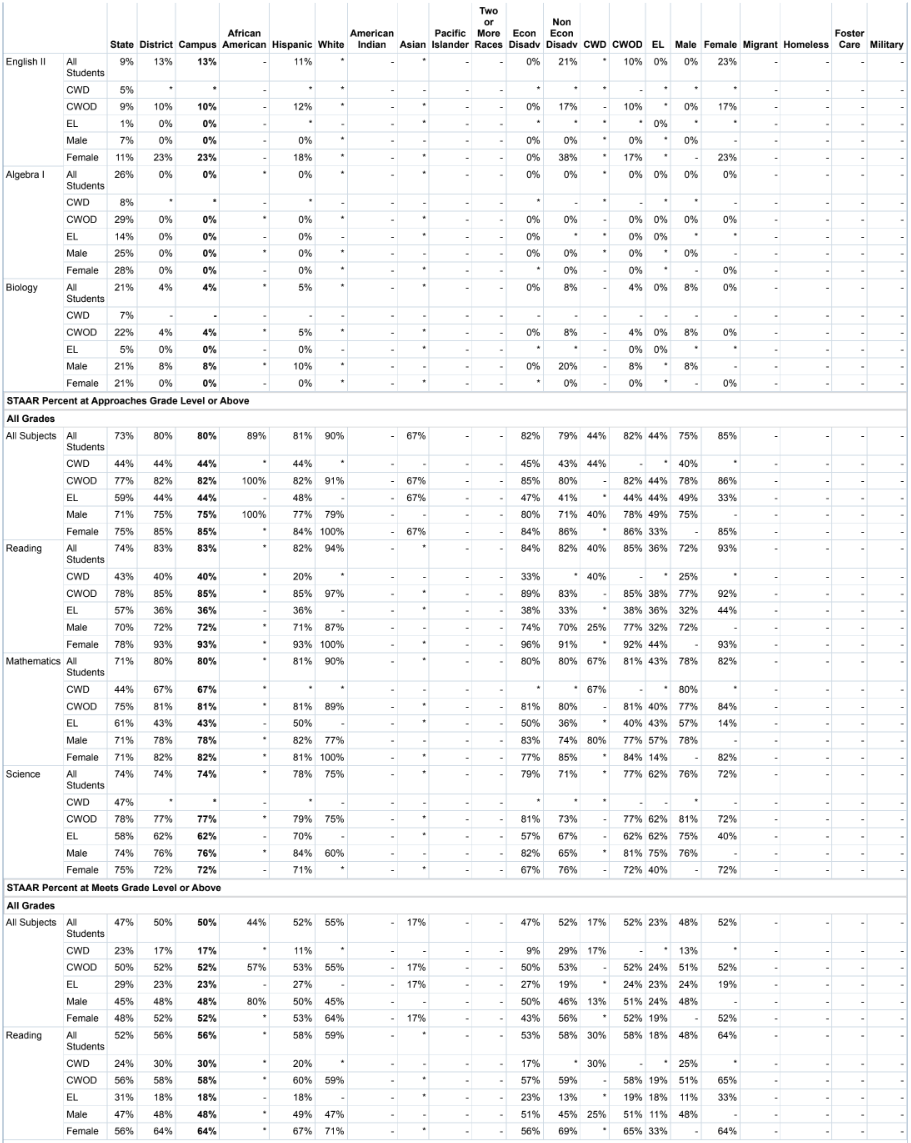
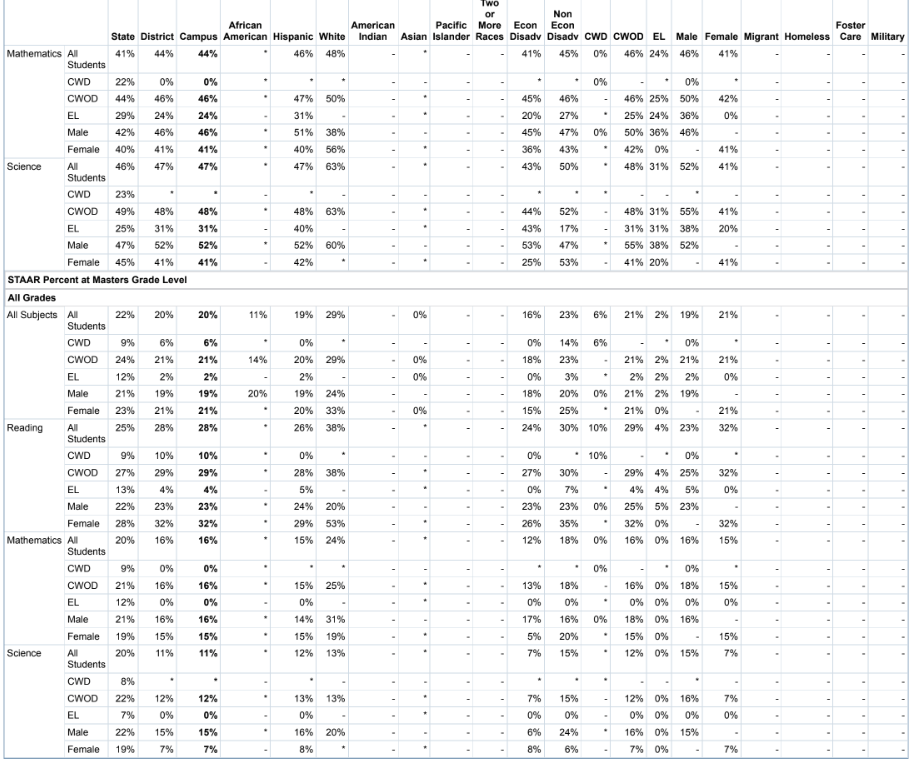
a. Academic Achievement Indicator: STAAR Performance Status (Percent at Meets Grade Level or Above)
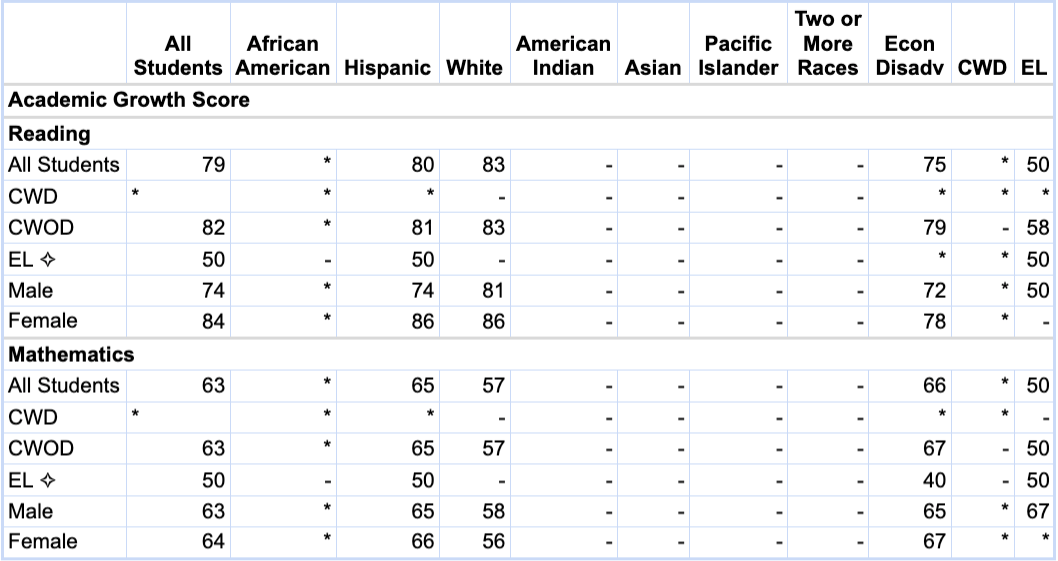
b. Other Academic Indicator for Non-High Schools: STAAR Growth Status
c. Graduation Rate: Federal Graduation Status
d. ELP Indicator: English Learner Language Proficiency Status
e. School Quality or Student Success (SQSS) Indicators: College, Career, and Military Readiness for High Schools and K-12
Student Achievement Domain Score: STAAR only for All Other Schools without Annual Graduates
Part (i)(IV) the State's system for meaningfully differentiating all public schools in the State, including --
(aa) the specific weight of the indicators in such differentiation
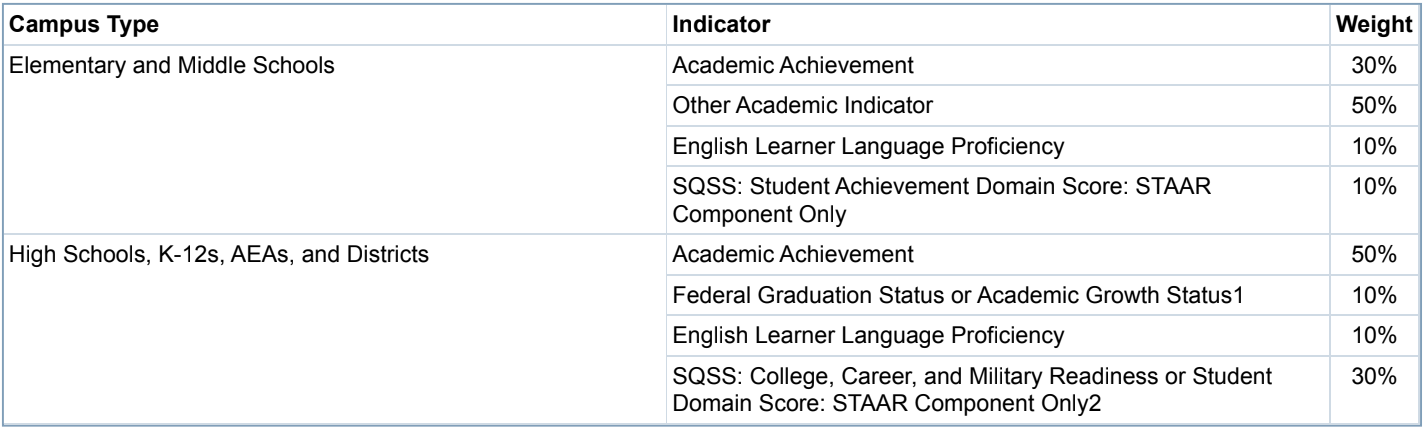
1 If Federal Graduation Status is not available, Academic Growth Status is used.
2 If College, Career, and Military Readiness is not available, Student Achievement Domain Score: STAAR Component Only is used.
(bb) the methodology by which the State differentiates all such schools. A weighted average of the accountability indicators will be computed from the number of items meeting targets divided by the number of items evaluated. The weighted average will be scaled to grades A (90-100), B (80-89), C (70-79), D (60-69), and F (0-59) and further used to differentiate all public schools.
https://tea.texas.gov/sites/default/files/chapter-4-2022-closing-the-gaps-domain.pdf
(cc) the methodology by which the State differentiates a school as consistently underperforming for any subgroup of students.TEA uses the Closing the Gaps domain to identify campuses that have consistently underperforming student groups. A student group that misses the targets in at least the same three indicators, for three consecutive years, is considered consistently underperforming. Any campus not identified for comprehensive support and improvement (CSI) that has at least one consistently underperforming student group is identified for targeted support and improvement (TSI). TSI identifies both Title I and non-Title I campuses. Data from 2018, 2019, and 2022 are considered consecutive years for 2022 TSI identification.
(dd) the methodology by which the State identifies a school for comprehensive support and improvement. Title I campuses based on Closing the Gaps scaled scores. Beginning August 2022, TEA also evaluates overall scaled scores to make final comprehensive support and improvement (CSI) determinations. Title I campuses with both the lowest Closing the Gaps and lowest overall scaled scores are identified for CSI. First, Texas determines the bottom five percent of Closing the Gaps outcomes by rank ordering the scaled scores of Title I campuses by school type - elementary, middle, high school/ K - 12, and alternative education accountability. Texas then determines which campuses fell in the bottom five percent for each school type. Next, TEA rank orders the overall scaled scores for all Title I campuses statewide (without regard to campus type) to determine the scaled score cut point necessary to identify at least five percent of Title I campuses. Title I campuses with an overall scaled score cut point at or below the overall cut point and that rank in their school types bottom five percent are identified for CSI.
Part (i)(V) the number and names of all public schools in the State identified by the State for comprehensive support and improvementor implementing targeted support and improvement plans. Campuses Identified for Support under the Every Student Succeeds Ac (ESSA) for the 2022-2023 school year: Comprehensive Support and Improvement Schools , Targeted Support and ImprovementSchools and Additional Targeted Support Schools .
Part (i)(VI) the exit criteria established by the State, including the length of years established. Campuses that do not rank in their school types bottom five percent of the Closing the Gaps domain for two consecutive years and have an overall scaled score that year that does not fall within the lowest percentile to be reidentified for CSI are considered as having successfully exited. Campuses previously identified as CSI based solely on a graduation rate below 67 percent must have a four or six-year federal graduation rate of at least 67 percent for two consecutive years to exit CSI status.
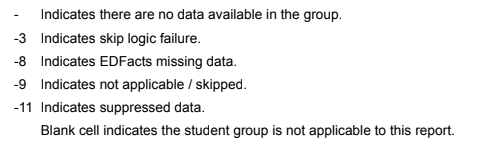
- Indicates there are no students in the group.
* Indicates results are masked due to small numbers to protect student confidentiality.
Part (iii): Academic Growth and Graduation Rate
Part (iii)(I): Academic Growth
This section provides information on students' academic growth for mathematics and reading/ELA for public elementary schools and secondary schools which don't have a graduation rate, for the 2021-22 school year. These results include all students tested, regardless of whether they were in the accountability subset. (CWD: children with disability; CWOD: children without disability; EL: English learner)
- Indicates there are no students in the group.
* Indicates results are masked due to small numbers to protect student confidentiality.
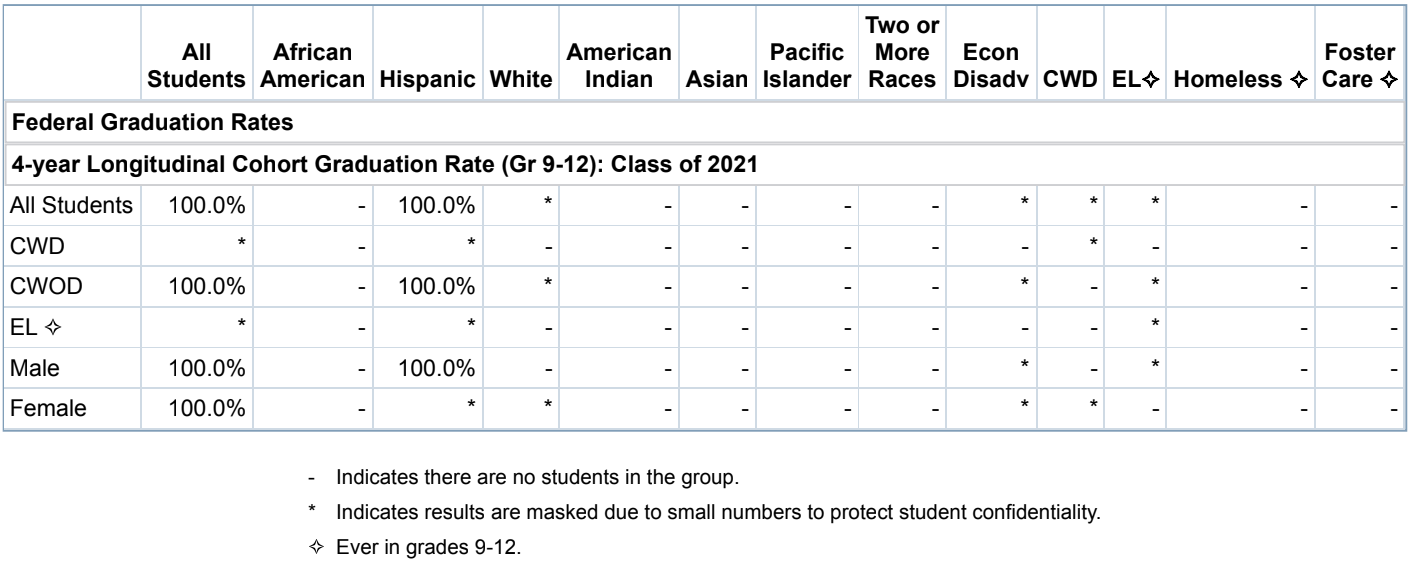
Part (iii)(II): Graduation Rate
This section provides information on high school graduation rates for the class of 2021.
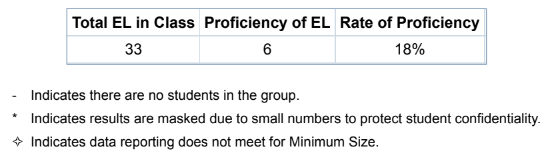
Part (iv): English Language Proficiency
This section provides information on the number and percentage of English learners achieving English language proficiency based on the 2022 TELPAS (Texas English Language Proficiency Assessment System) data. (EL: English learner)
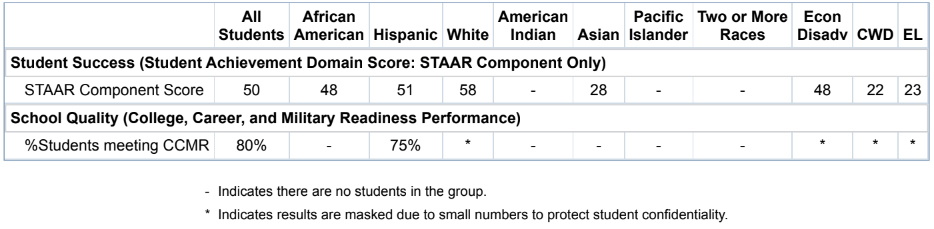
Part (v): School Quality or Student Success (SQSS)
This section provides information on the other indicators of school quality or student success, which is college, career and military readiness (CCMR) for high schools and average performance rate of the three STAAR performance levels of all students, regardless of whether they were in the accountability subset, for elementary and secondary schools without a graduation rate. (CWD: children with disability; EL: English learner)
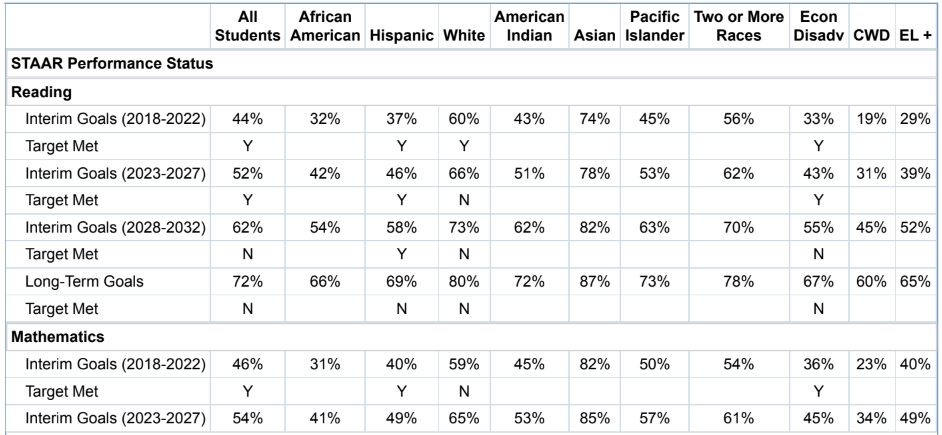
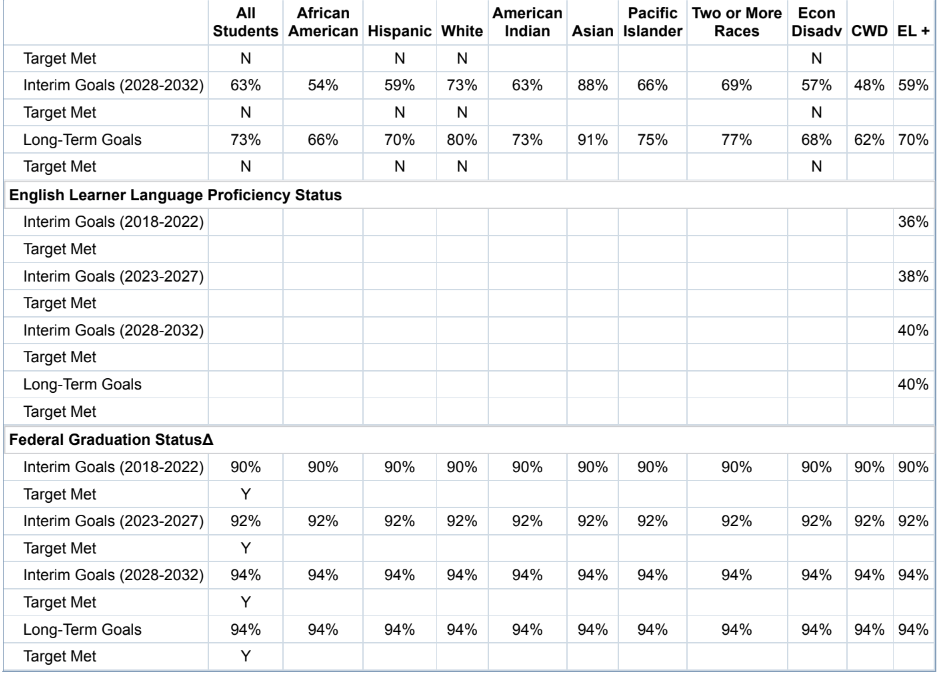
Part (vi): Goal Meeting Status
This section provides information on the progress of all students and each student group toward meeting the long-term goals or interim objectives on STAAR academic performance, federal graduation rate, and English learners' language proficiency. (CWD: children with disability; EL: English learner)

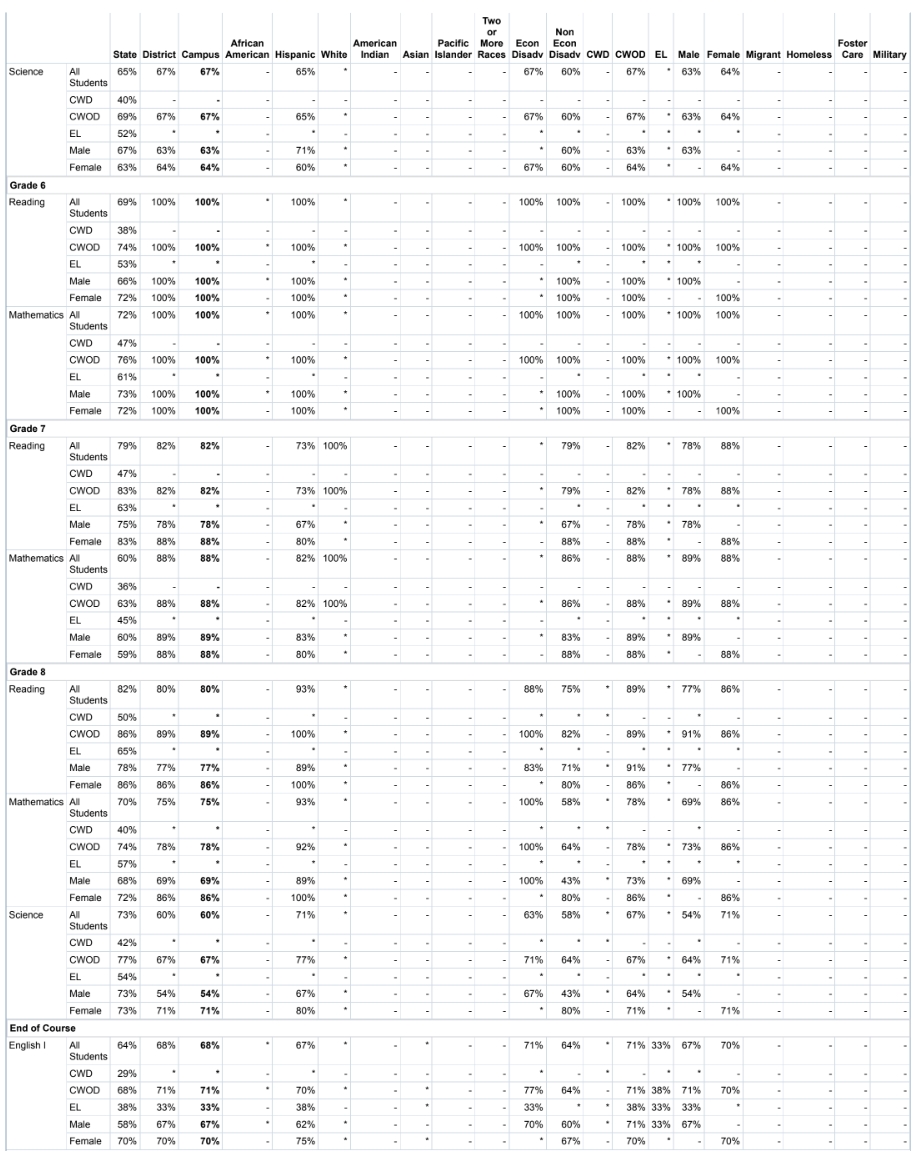
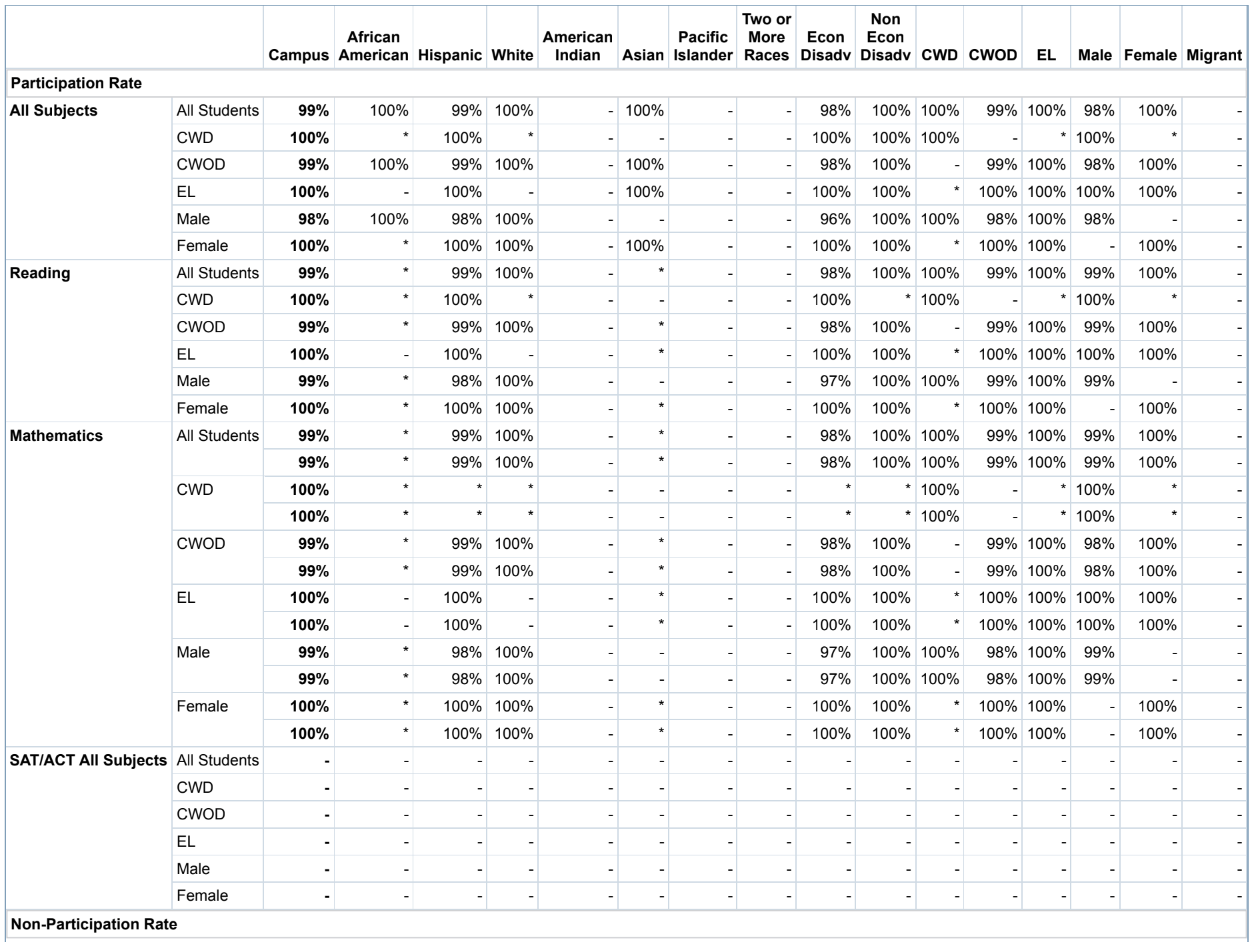
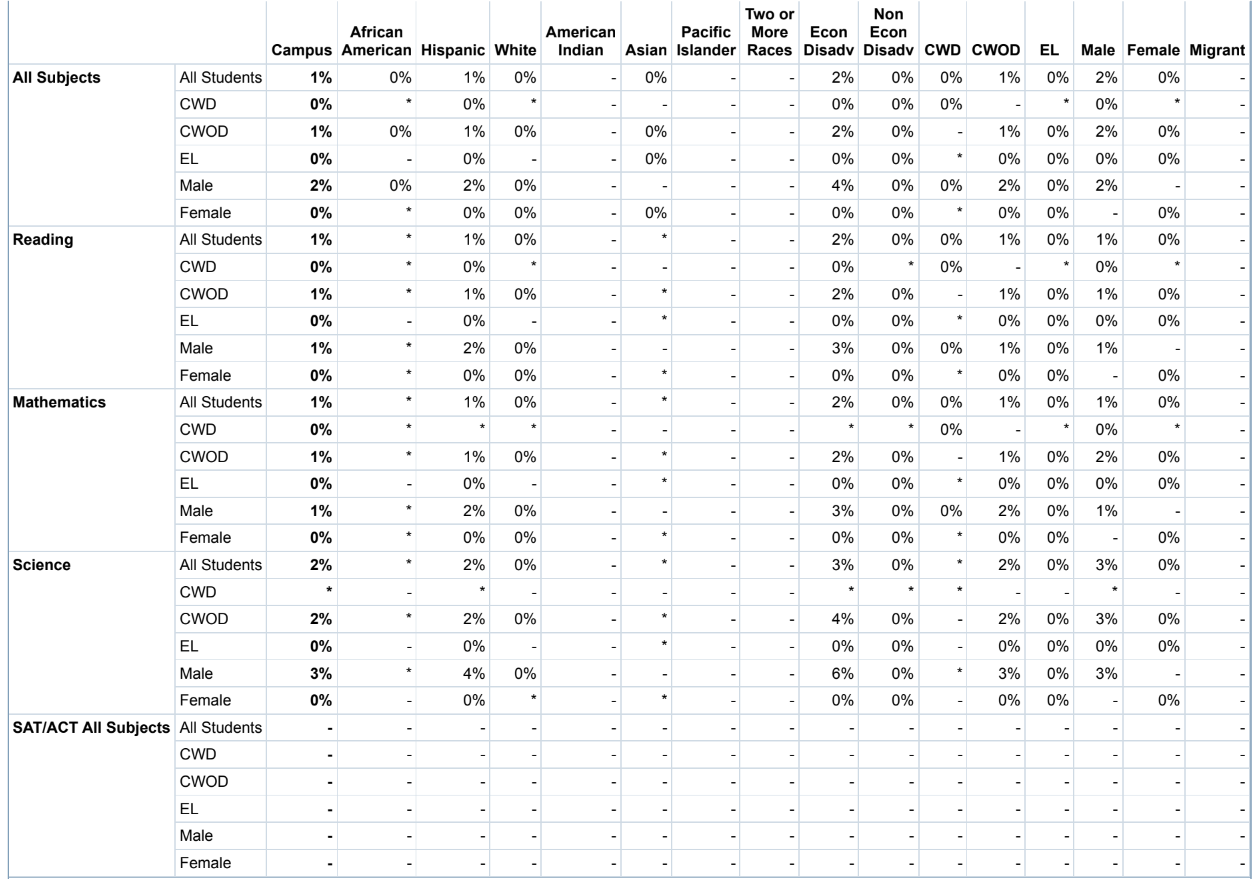
Part (vii): STAAR Participation
This section provides the percentage of students assessed and not assessed on STAAR for mathematics, reading/ELA, and science for the 2021-22 school year. (CWD: children with disability; CWOD: children without disability; EL: English learner)
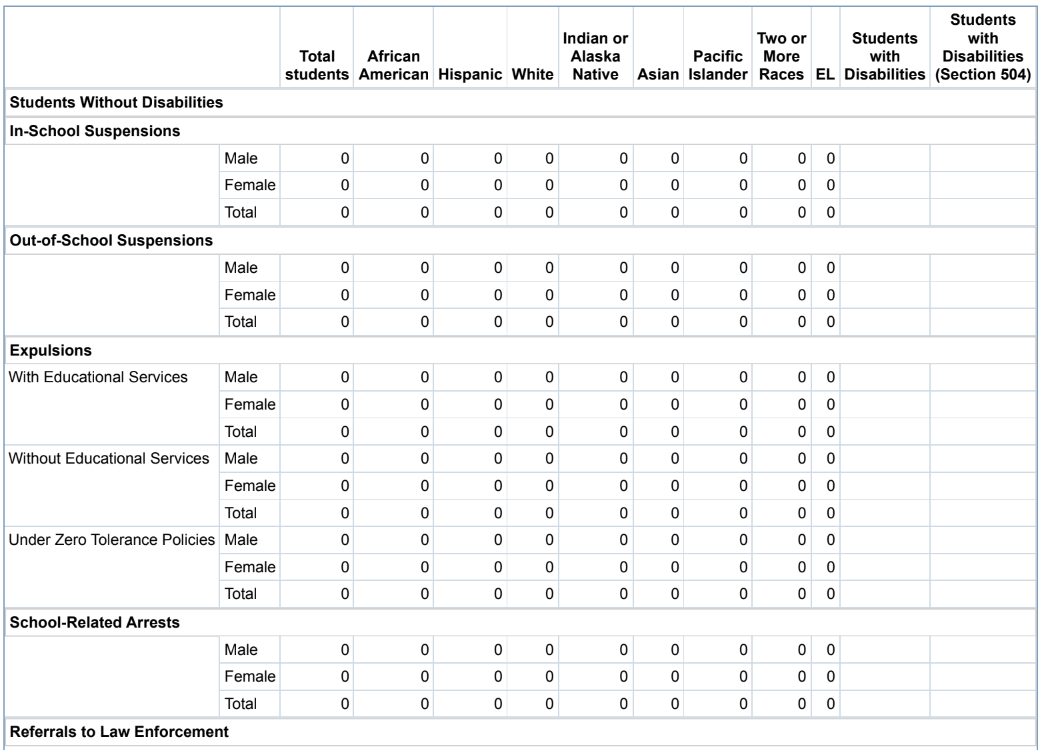
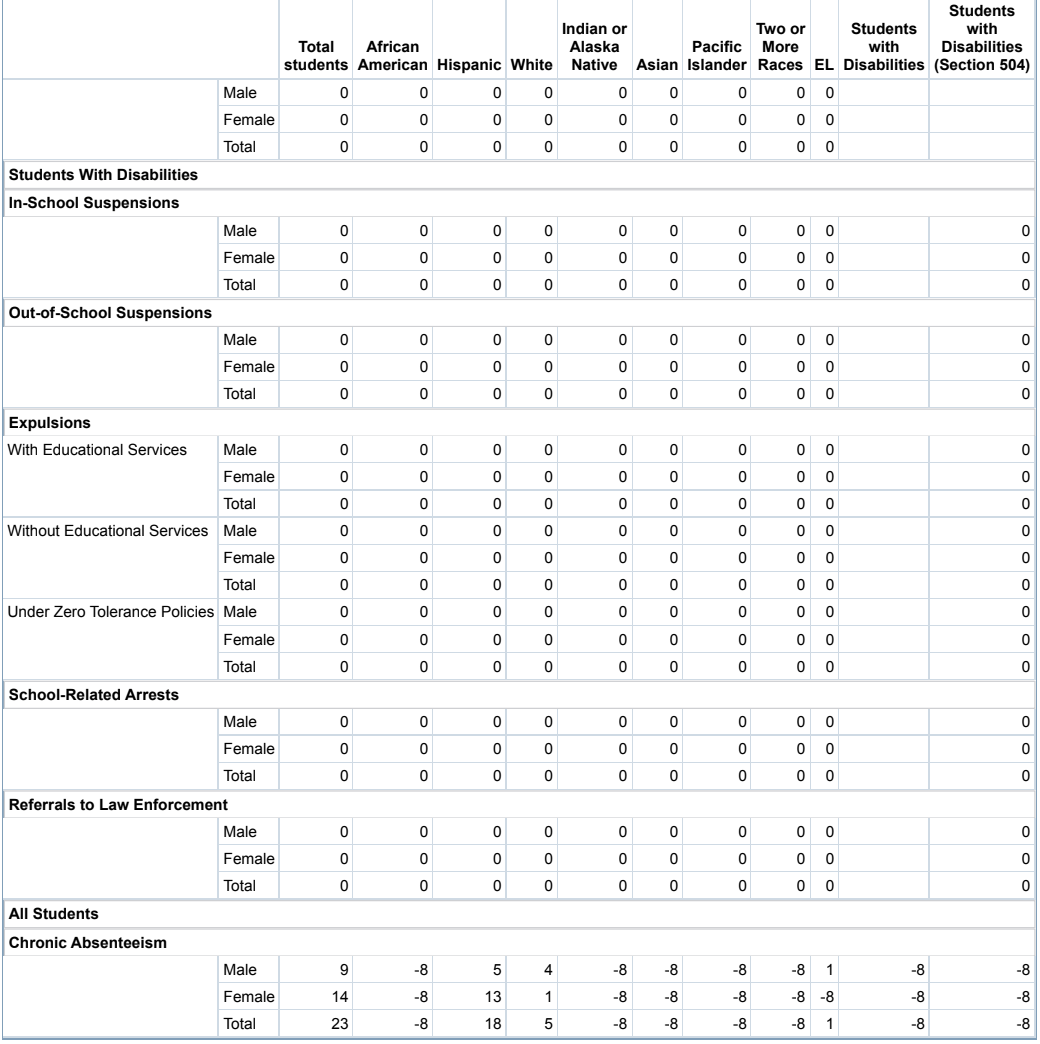
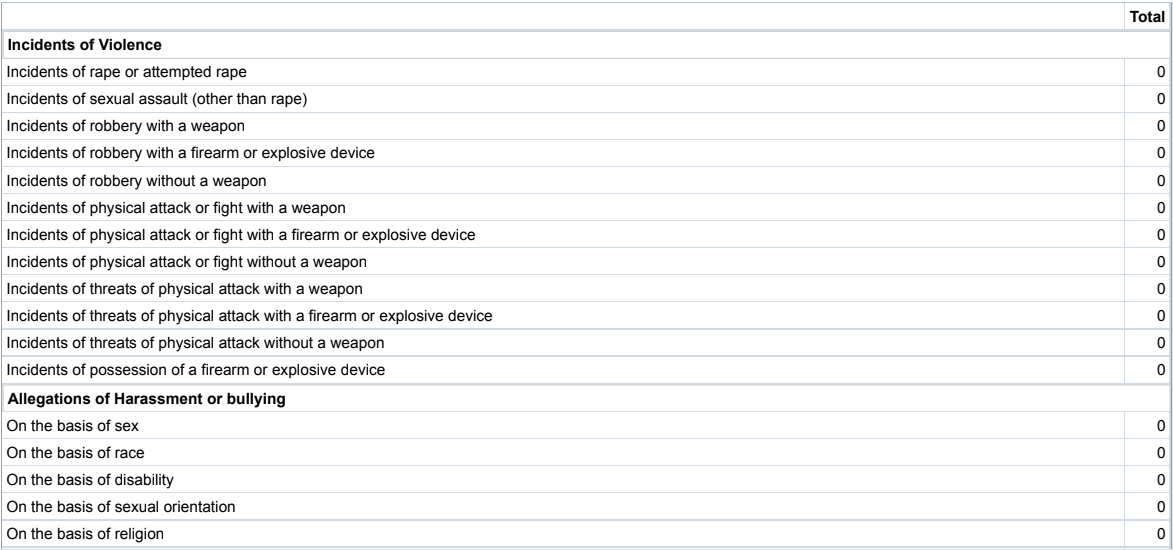
Part (viii): Civil Rights Data
Part (viii)(I) This section provides information from the 2017-18 CRDC surveys, submitted by school districts to the Office for Civil Rights on measures of school quality, climate, and safety, including counts of in-school suspensions, out-of-school suspensions, expulsions, school related arrests, referrals to law enforcement, chronic absenteeism (including both excused and unexcused absences), incidences of violence, including bullying and harassment. (EL: English learner)
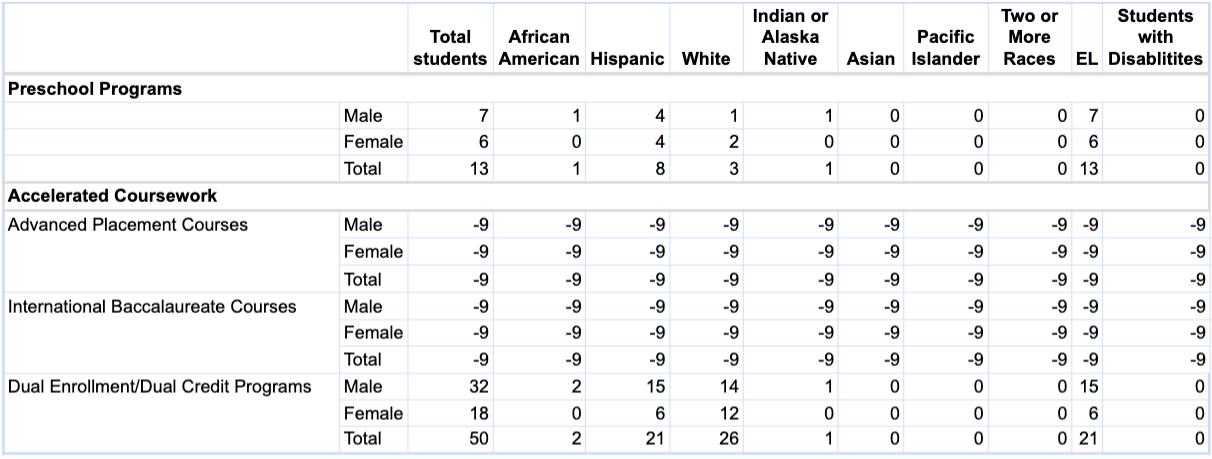
Part (viii)(II) This section provides information from the 2017-18 CRDC surveys, submitted by school districts to the Office for Civil Rights, on the number of students enrolled in preschool programs and accelerated coursework to earn postsecondary credit while still in high school.
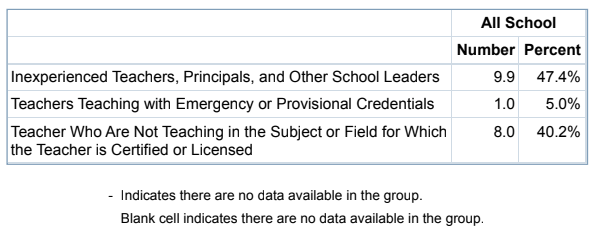
Part (ix): Teacher Quality Data
This section provides information on the professional qualifications of teachers, including information disaggregated by high- and low-poverty schools on the number and percentage of (I) inexperienced teacher, principals, and other school leaders; (II) teachers teaching with emergency or provisional credentials; and (III) teachers who are not teaching in the subject or field for which the teacher is certified or licensed.
Part (x): Per-pupil Expenditure
This section provides information on the per-pupil expenditures of federal, state, and local funds, including actual personnel expenditures and actual non-personnel expenditures, disaggregated by source of funds, for each school district and campus fort he preceding fiscal year.
To be updated by June 30th, 2023.
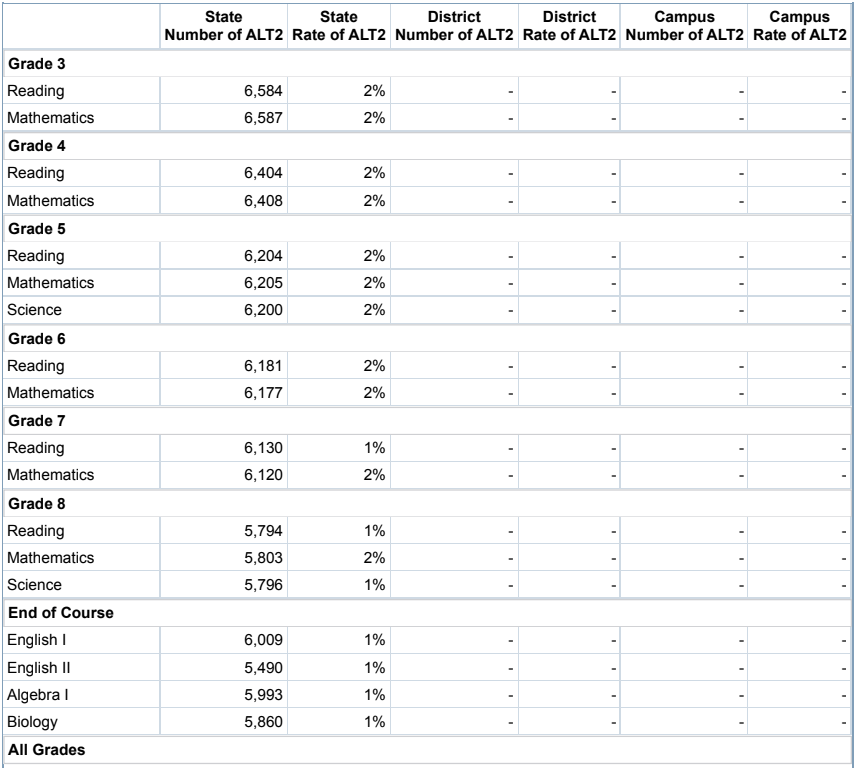
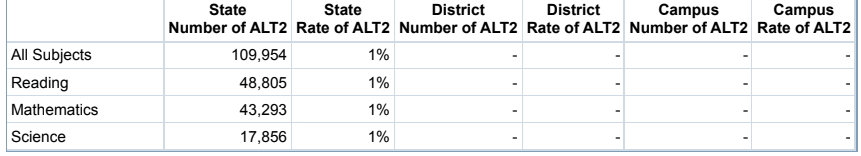
Part (xi): STAAR Alternate 2 Participation
This section provides information on the number and percentage of students with the most significant cognitive disabilities who take STAAR Alternate 2, by grade and subject for the 2021-22 school year.
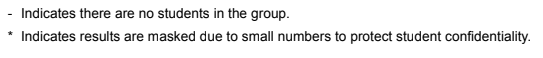
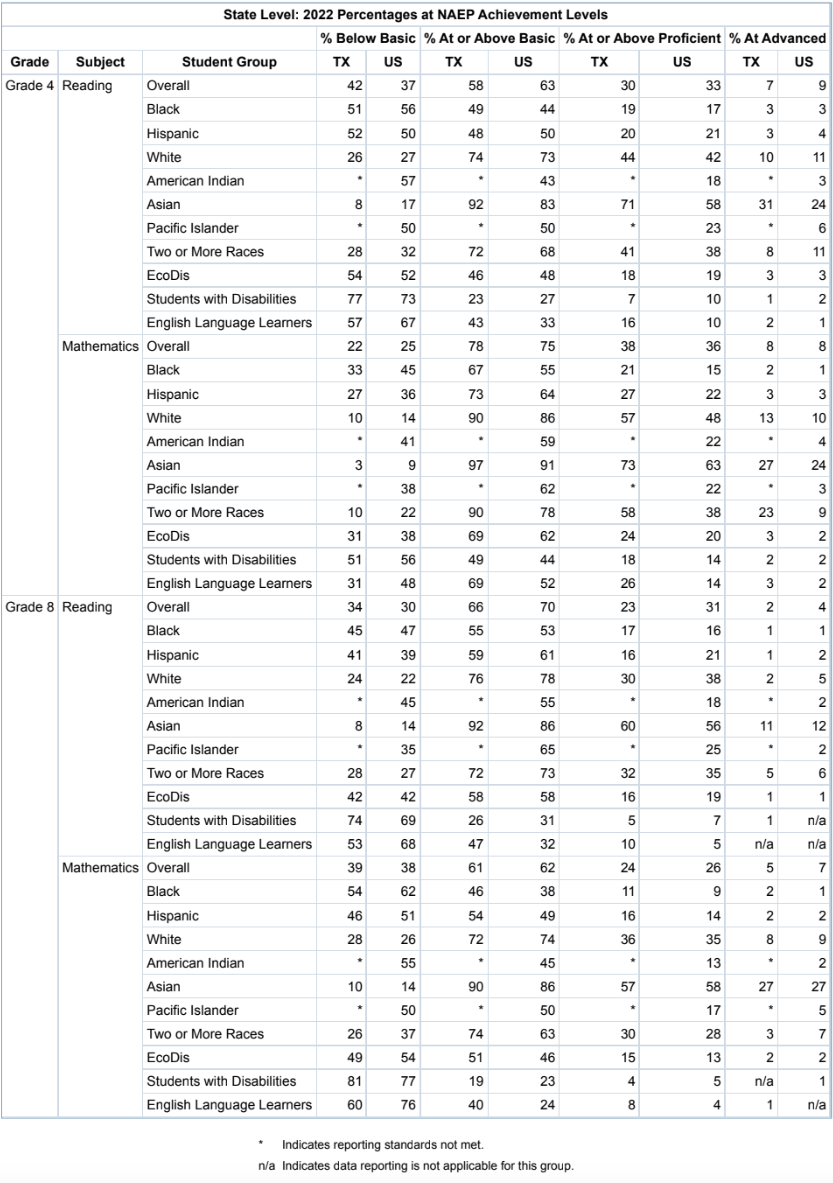
Part (xii): Statewide National Assessment of Educational Progress (NAEP)
This section provides results on the state academic assessments in reading and mathematics in grades 4 and 8 of the 2022 National Assessment of Educational Progress, compared to the national average of such results.
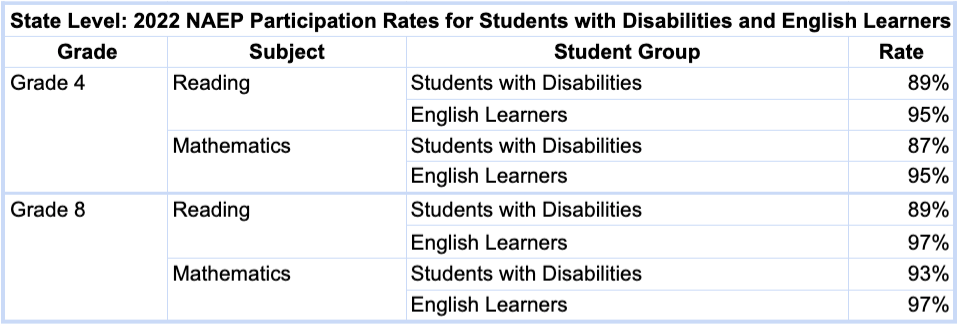
Part (xiii): Cohort Rate of Graduates Enrolled in Postsecondary Education
This section provides information on the cohort rate at which students who graduated from high school in the 2019-20 school year enrolled in a Texas public postsecondary education institution in the 2020-21 academic year in (I) programs of public postsecondary education in Texas; (II) programs of private postsecondary education in Texas; and (III) programs of postsecondary education outside Texas. (CWD: children with disability; EL: English learner)
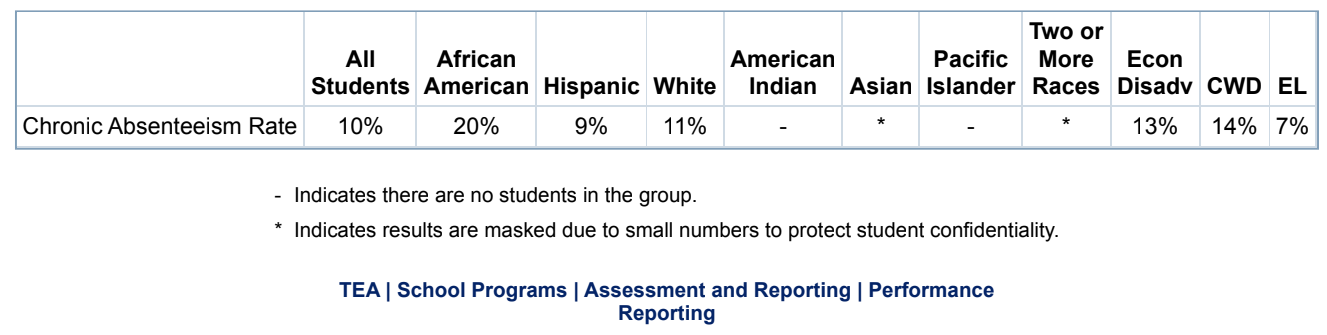
Part (xiv): Additional Information - Chronic Absenteeism
This section provides information on the Chronic Absenteeism per EDFacts definition: percent of unduplicated number of K - 12 students enrolled in a school for at least 10 days and absent for 10% or more days during the 2020-21 school year. (CWD: children with disability; EL: English learner)